
Military Airfields / Reports
Airfield Reports and Analytics
Five built-in reports plus live analytics, generated straight from airfield records.
By the time a report's built by hand, it's already out of date
A quarter's discrepancy trend, today's open count, last month's lighting outages. Each is a different question, and normally each one sends somebody digging through a different export, an old spreadsheet, or whatever they remember from the last time someone asked.
None of that activity was ever missing. It was logged the day it happened, by whichever module handles checks, discrepancies, or lighting status. The report just has to catch up to records that already exist, instead of being rebuilt from them all over again.
Every report already built, the numbers refreshed on load
One report per question, five in total
A Daily Operations Summary opens to a chosen date or range; an Airfield Lighting Report opens to system health and outages. Five reports, covering discrepancies, their trend over time, and how long they've aged, each filtering on its own terms (a shop, a status, an aging tier) instead of one export trimmed down after the fact.
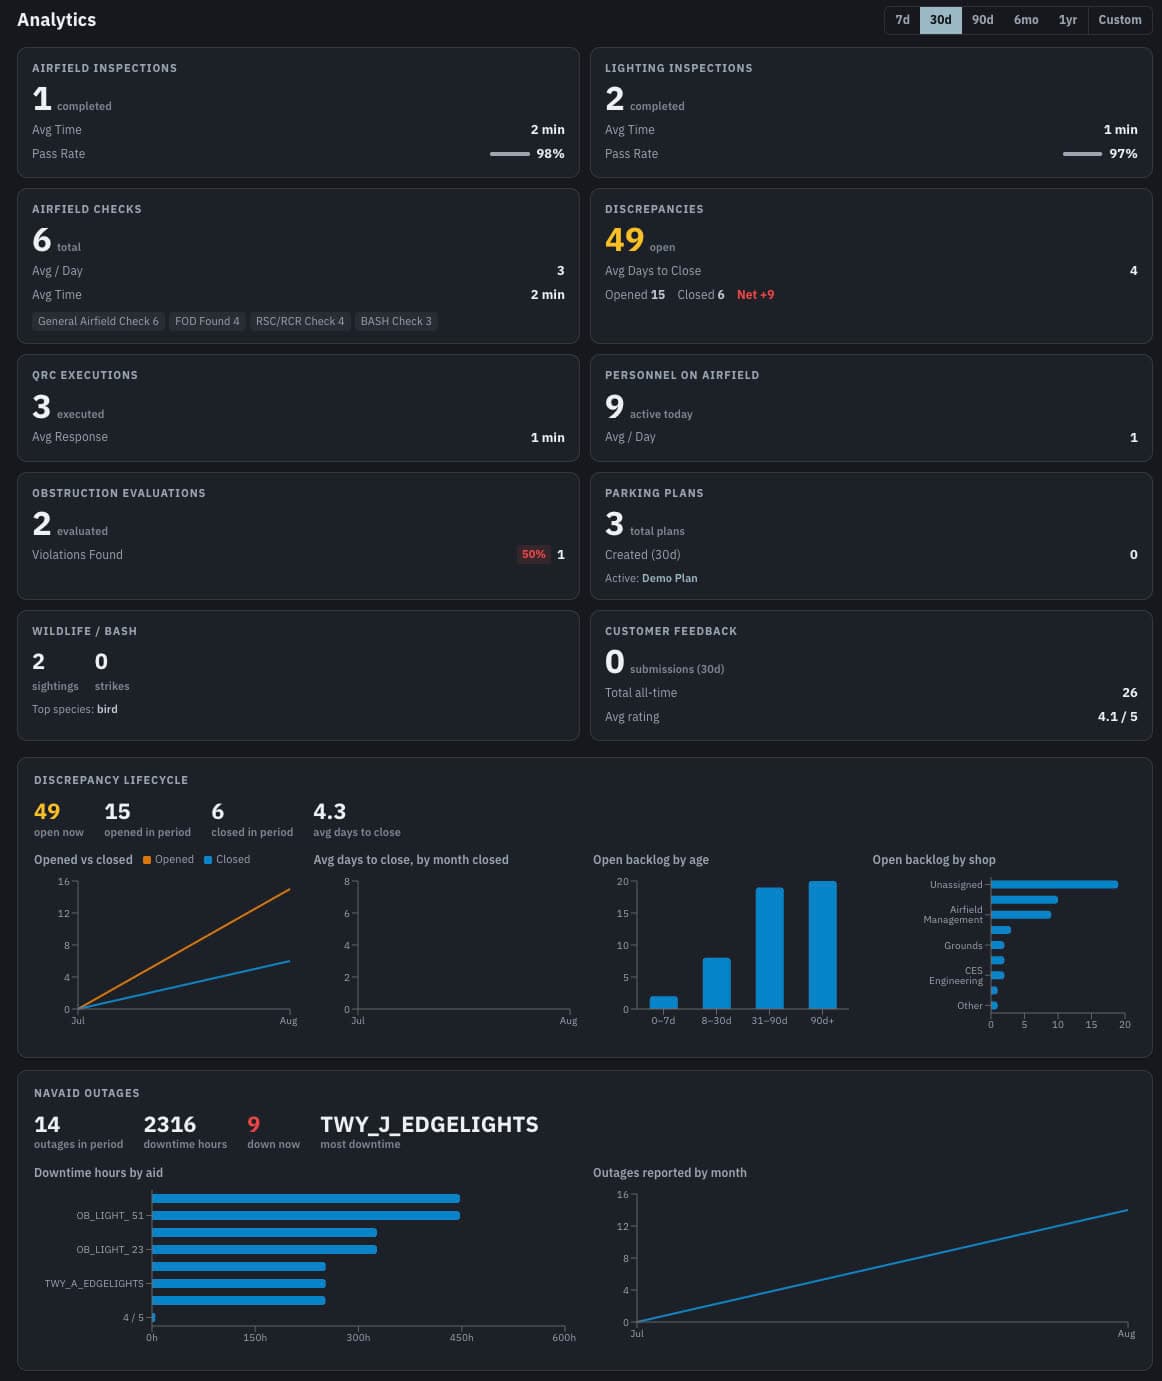
The Analytics panel reads current, not cached
Airfield checks, discrepancies, QRC executions, personnel on the airfield, obstruction evaluations, and parking plans all read as of right now, across whichever range is selected: 7d, 30d, 90d, 6mo, 1yr, or Custom.
One window sets every tile at once
Pick a range once, and every tile on the panel measures against it: no card is left showing yesterday's window while the rest have moved on.
Built in the browser, nothing to reassemble later
Every report and export renders as a PDF or Excel file the moment it's requested, straight from the records already in the platform, not a separate copy kept somewhere else for reporting.
What it automates
Aging discrepancies and lighting trends, without a manual count
The aging report sorts open discrepancies by how long they've sat and who owns them; discrepancy trends and the lighting report chart that same activity over time, so nobody is counting rows to answer either question.
A daily summary that's the day's actual record
The Daily Operations Summary for a chosen date or range comes from checks, inspections, and status changes as they were logged at the time, not reconstructed afterward from notes or memory.
Every number traces back to a record, not a tally
The discrepancy count on a report opens straight into the same discrepancy records used everywhere else in the platform: shop, status, and history all still attached, not a number copied out on its own.
Straight answers
What are the five reports in this module?
A Daily Operations Summary for a date or range, a Discrepancy Report and Discrepancy Trends covering open findings and their pattern over time, Aging Discrepancies for how long items have sat, and an Airfield Lighting Report for system health: five reports, each filtered and exported on its own terms.
Does the Analytics panel update on its own?
Yes. It isn't a cached snapshot: every tile recomputes from current records as soon as the panel opens, across whichever range is selected.
Do exports include everything, or just what's filtered?
Just what's filtered. Narrow by status, shop, location, date range, or aging tier first, then export exactly that slice as a PDF or Excel file, generated in the browser.
Does generating a report send data to a server?
No. Every report and export builds client-side in the browser from records already in the platform, so nothing is rebuilt on a server or re-entered by hand.