
Civilian Airports / Reports
Airport Reports and Analytics
Daily operations, trends, aging, and lighting analytics on demand.
A trend over the quarter and today's headcount aren't the same report
A discrepancy trend over the last quarter, a single day's activity for an incident review, this month's inspection pass rate: three different questions, and normally three different places to go dig for each answer.
A live number is a different thing entirely. How many discrepancies are open right now, or how many contractors are on the field today, goes stale the moment it's pulled out and shared somewhere else, so the version people end up looking at is often already behind.
Purpose-built reports and a live analytics view, in one place
Each report answers one specific question
A daily activity summary, a discrepancy report, a trend view, an aging report, and a lighting-system report each filter and export on their own terms, instead of one generic dump trying to cover all of them.
Analytics reads live, not from a snapshot
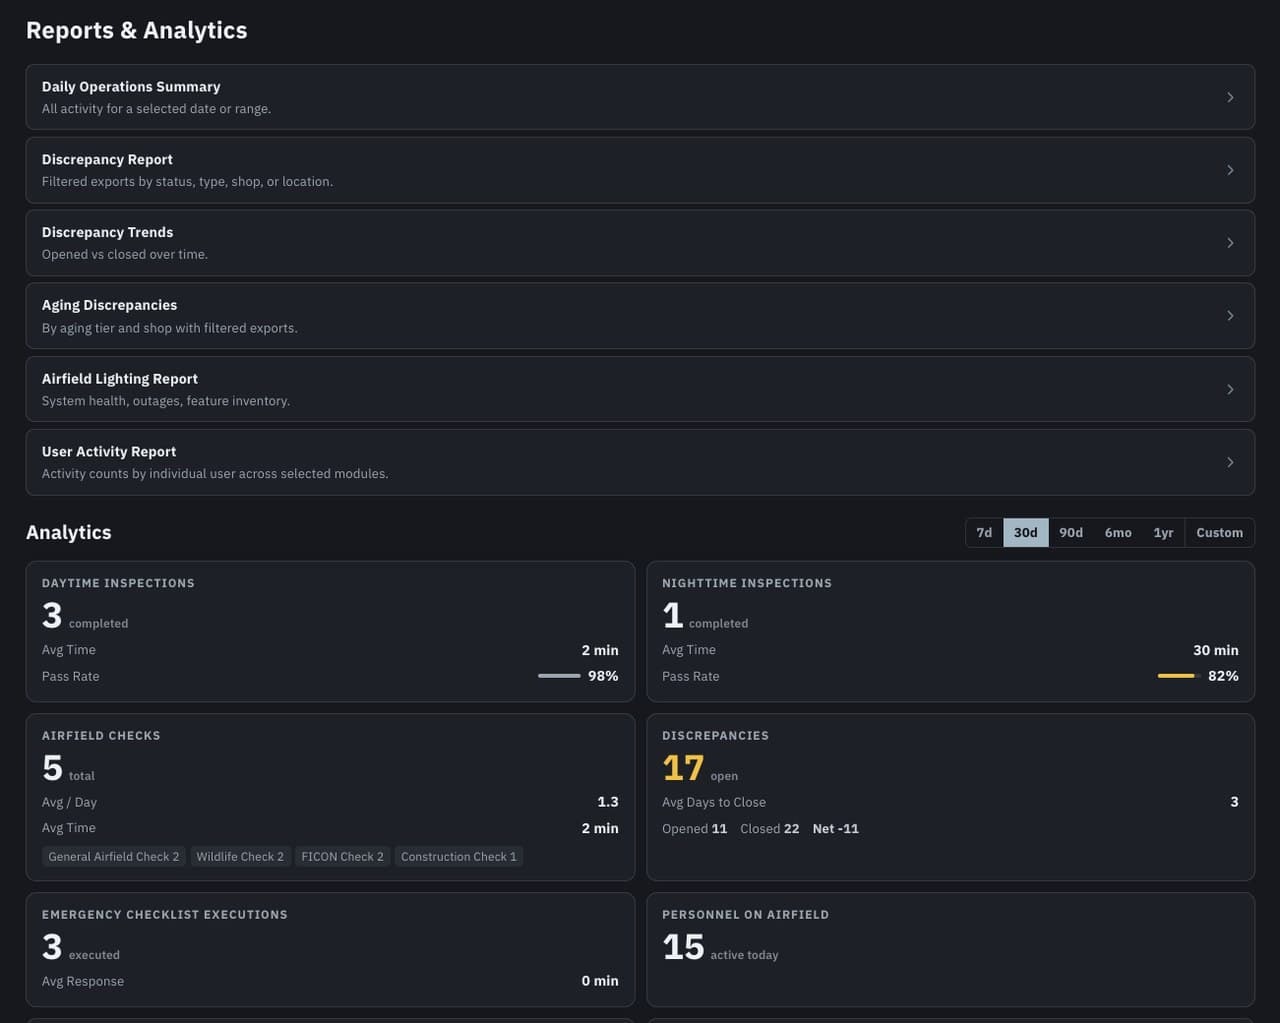
A single view of current numbers (inspections completed, discrepancies open, contractors active, parking plans on file, and more), recalculated fresh every time the page opens.
One time window drives the whole view
Switch between 7 days, 30, 90, six months, a year, or a custom range, and every card on the page recalculates against that same window at once.
Each report narrows before it exports
Status, type, shop, location, or aging tier: the underlying reports filter down to the slice that's needed before anything gets exported.
What it automates
Five reports, five different questions answered
Each report is already shaped for the question it answers (a trend, an aging tier, a single day's log), not a generic export reshaped after the fact.
The numbers are live, not a screenshot
Analytics recomputes the moment the page opens, so what's on screen reflects where things stand right now, not whenever it was last pulled.
One time window, the whole picture at once
Switching the window updates every card simultaneously, so nothing on the page is quietly answering a different question than the rest.
Straight answers
What reports does the module include?
A daily operations summary, a discrepancy report, discrepancy trends, an aging report, and a lighting-system report, each filterable and exportable on its own.
How current are the analytics numbers?
They recalculate the moment the page opens or the time window changes. There's no manual refresh step to remember.
Can I set a custom date range for analytics?
Yes. Alongside the 7-day, 30-day, 90-day, six-month, and one-year presets, a custom range lets you pick exact start and end dates.
Can each report be filtered before I export it?
Yes, by status, type, shop, location, or aging tier, depending on the report, so the export matches exactly what was asked for.